New Approaches to Ethno-Linguistic Maps
I’m excited to give a guest blog post here at humans who read grammars on new methods in language geography. I’m a geographer by trade, and I am currently a PhD student at the University of Maryland. I also work for an environmental nonprofit - Conservation International - doing data science on agriculture and environmental change in East Africa. Before ending up where I am now, I lived for some time in West Africa and the Philippines. During my time in both of those linguistically-rich areas, I became quite interested in language geographies and linguistics more generally. Spurned on by curiosity and my disappointment in available resources, I’ve done some side projects mapping languages and language groups, which I’ll talk about here.
Problems with Current Language Maps
 |
| A map of tonal languages from WALS. Fascinating at a global scale, but unsatisfying if you zoom in to smaller regions. |
One major issue with most modern maps of languages is that they often consist of just a single point for each language - this is the approach that WALS and glottolog take. This works pretty well for global-scale analyses, but simple points are quite uninformative for region scale studies of languages. Points also have a hard time spatially describing languages that have disjoint distributions, like English, or languages that overlap spatially. See here for a more in-depth discussion of these issues from Humans Who Read Grammars
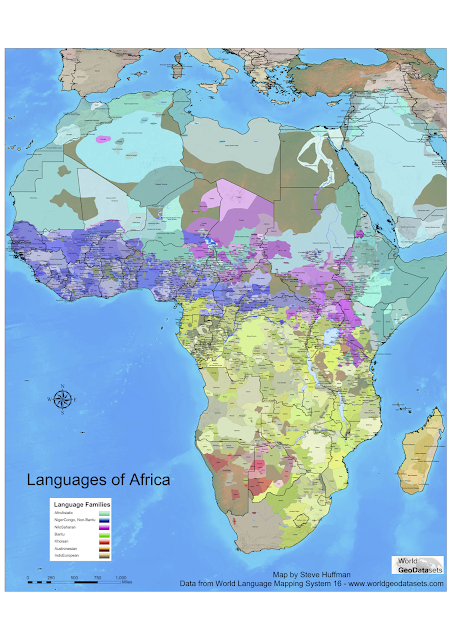
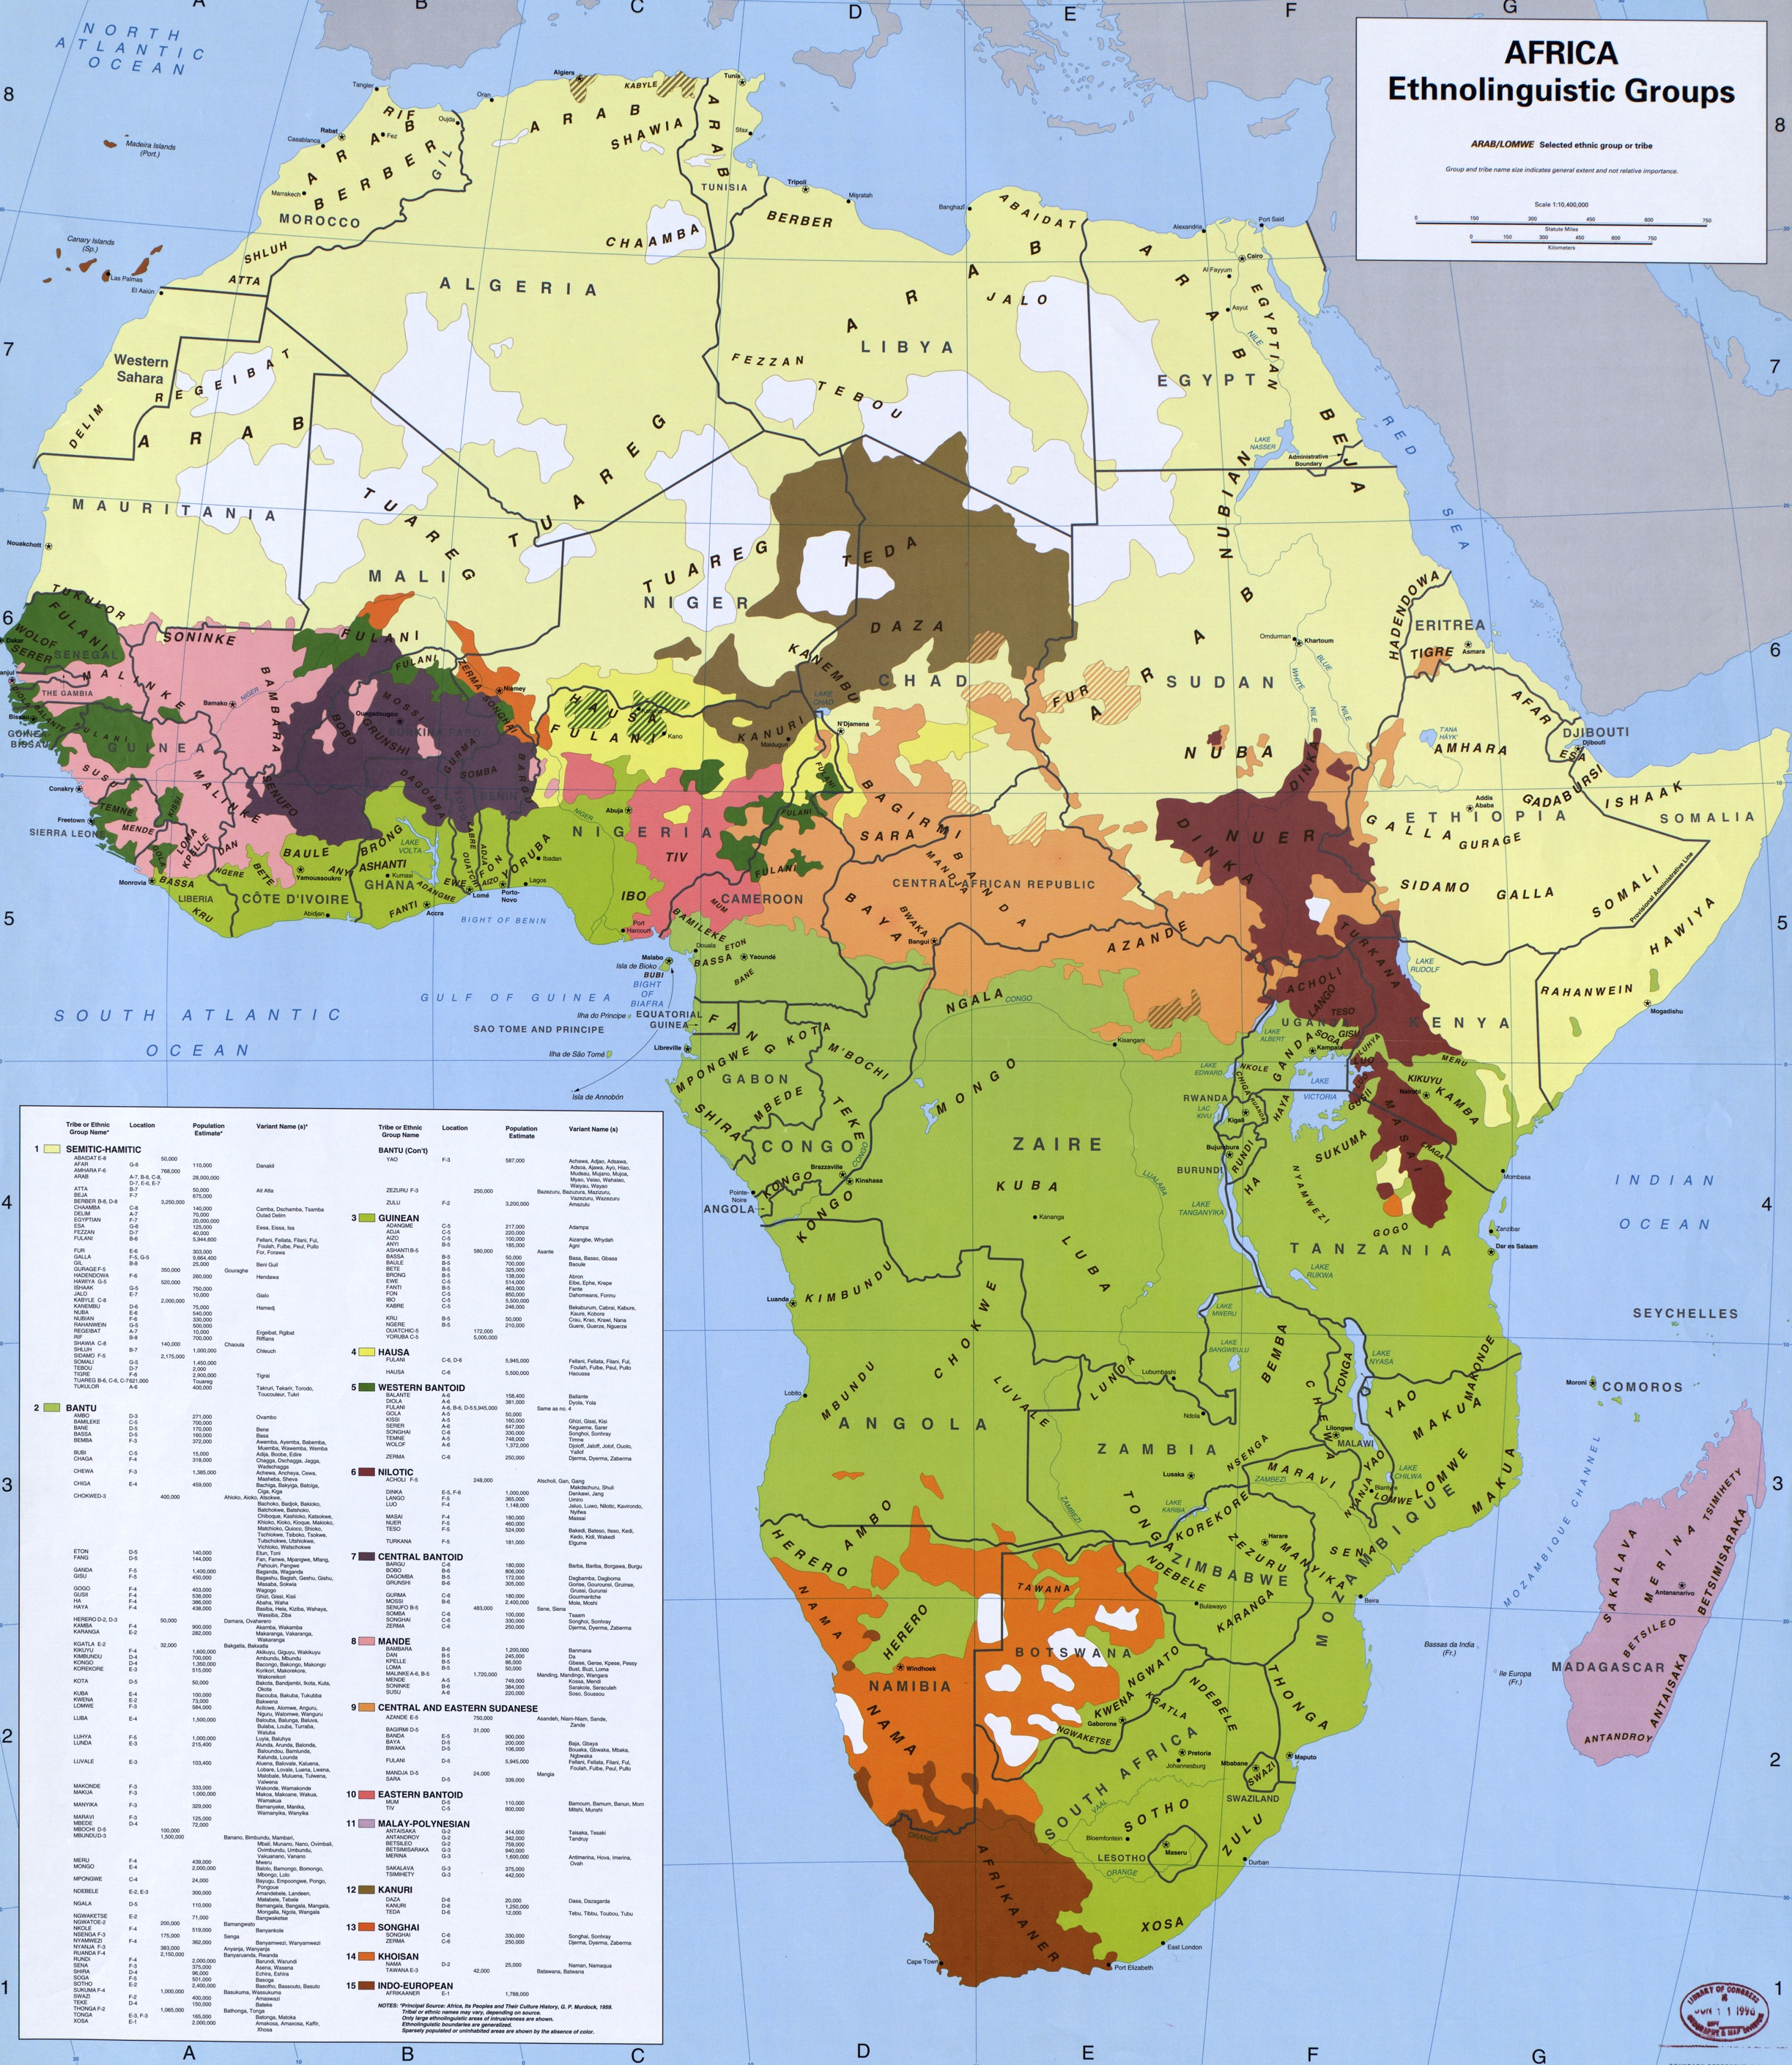
One reason that most language geographers go for the one-point-per-language approach is that using a simple point is simple, while mapping languages across regions and areas is very difficult. An expert must decide where exactly one language ends and another begins. The problem with relying on experts, however, is that no expert has uniform experience across an entire region, and thus will have to rely on other accounts of which language is prevalent where. This is how, for example, the Murdock Map of African ethno-linguistic groups was created. As a continental scale map, it is rich and fascinating. However, looking for closely at specific region, and the map seems to have problems - how did Murdock know exactly the shape of each little wiggle identifying the boundary between two groups? What about areas where two different groups overlap? Other issues can arise when trying to distinguish distinct groups when often the on-the-ground reality is that a language may exist as a dialect continuum, something that subjectively drawing polygons does not readily account for.
These maps can have real import when they form the foundation of other analyses. Researchers have examined whether ethnic diversity in developing countries, and in Africa in particular, can hamper economic development and lead to conflict. Scientists disagree, although many analyses use the Murdock map. See some of this research here, here and here. Another study, recently published in Science, looked at Internet penetration in areas where politically excluded ethnic groups live. They found that groups without political power were often marginalized in terms of internet service provision. However, their data for West Africa, which came from the Ethnic Power Relations database, was quite rough: all of southern Mali was one ethnic group labeled "blacks" while the north was labeled as "Tuaregs" or "Arabs", while there was no data at all for Burkina Faso. While their findings were important and they did the best that they could with available datasets, a less informed analysis from the same data could end up looking like linguistics done horribly wrong. We need better ethno-linguistic maps simply to do good social science and address these critical questions.
New Methods and Datasets
I believe that, thanks to greater computational efficiency offered by modern computers and new datasets available from social media, it is increasingly possible to develop better maps of language distributions using geotagged text data rather than an expert’s opinion. In this blog, I’ll cover two projects I’ve done to map languages - one using data from Twitter in the Philippines, and another using computationally-intensive algorithms to classify toponyms in West Africa.
I should note that for all its hype, big data can be pretty useless without real-world experience. The Philippines and West Africa are two parts of the world where I have spent a good amount of time and have some on-the-ground familiarity with the languages. Thus, I was able to use my local knowledge to inform how I conducted the analyses, as well as to evaluate their issues and shortcomings.
Case Study 1: Social Media From The Philippines
Many fascinating language maps from twitter have been created at global scales - see here, and here. However, to explore the distribution of understudied languages that don’t show up in maps of global languages, one must use more bespoke methods. This is especially true of austronesian languages like those found in the Philippines, which don’t have a lot of phonemic variability, and therefore aren’t easily classified using the methods that google translate uses. These methods, which rely on slices of the sample text, often confuse austronesian languages like Tagolog and Bahasa - just look at the maps I mentioned above. Thus, I had to use a word-list method, and created word lists from corpora offered by SEAlang, and by scraping from local-language wikipedia articles. The resulting maps show exactly where minority languages are used in comparison with English and Tagalog in the philippines, and likely underestimate the prevalence of minority languages because the corpora used (wikipedia and the bible) are quite different from the twitter data that was classified.
 |
| Languages of Tweets in the Philippines. |
The resulting map shows about 125,000 tweets in English, Tagalog, Taglish (using Tagalog and English in the same tweet), and the local languages Cebuano, Ilocano, Hiligaynon, Kapampangan, Bikol, and Waray. This map offers more nuance than traditional language maps of the Philippines. For example, most maps would show Ilocano over the entire northern part of Luzon, but this map shows that the use of Ilocano is much more robust on the northwest coast than in the rest of the north. This analysis also allowed me to test a hypothesis that I frequently heard locals assert when in the Philippines - that English is more common in the south, because southerners would rather use English than Tagalog, which is seen as a northern language. I found that this was to be the case, and I was only able to confirm this because I had such a large sample size. Without newer datasets like those offered by social media, this hypothesis would be untestable.
Case Study 2: West African Toponyms
Another project I did used toponyms, or place names, from West Africa. Toponyms databases like geonames.org have relatively high spatial resolution - with a name for every populated place in an area. And while a place name is not as long as a tweet or other linguistic dataset, toponyms do encode ethno-linguistic information. It would be easy for someone familiar with Europe to distinguish whether a toponym is associated with the French or German linguistic group - a French name would likely begin with “Les” and end with “-elle”, while a German name could begin with “Der” and end with “-berg”. Similar differences exist between toponyms from different ethnic groups all over the world, and are quite evident to locals. What if you could train an algorithm to detect these differences, and then had it classify every single toponym throughout a region? That is what I tried to do in this analysis.
I used toponyms for six countries in French West Africa. I decided to focus on French West Africa for several reasons. For one, I have worked there, and have some familiarity with the ethnic groups of the region and their distributions, and it is an area I am very curious about. For another thing, this is a relatively poorly documented part of the world as far as ethno-linguistic groups go, and it is an area with significant region-scale ethnic diversity. Finally, the countries I selected were colonized by one group, meaning that all of the toponyms were transliterated the same way and could be compared even across national borders. In all, I used 35,785 toponyms.
First, I got a list of every possible set of three letters (called a 3-gram) from the toponyms. Then, I tested for spatial autocorrelation in the locations that contained each 3-gram using a Moran's I test, and selected only those 3-grams that had significant clustering.
To give an illustration of why this was necessary, here are two examples of the spatial distribution 3-grams. One 3-gram - "ama" - occurs roughly evenly throughout the regions in this study. The other 3-gram - "kro" - is very common in toponyms in south-east Côte d'Ivoire, and virtually nonexistent in other areas. Thus, "kro" has significant spatial autocorrelation whereas "ama" does not.
 |
| Here are all of the toponyms that contain the 3-gram "kro" |
 |
| And here are all of the toponyms that contain the 3-gram "ama" |
Thus, the the 3-gram "ama" doesn't tell us much about which ethnic group a toponym belongs to, because that 3-gram is found evenly distributed throughout West Africa - it is just noise. The 3-gram "kro", on the other hand, carries information about which ethnic group a toponym belongs to, because it is clearly clustered in a group in Southeast Côte d'Ivoire.
I then calculated the lexical distance between all of the toponyms based on the number shared 3-grams that had significant spatial autocorrelation. To add a spatial component, I also linked any two toponyms that were less than 25 kilometers apart. Thus, I had a graph where every toponym was a vertex, and undirected edges connected toponyms that had spatial or lexical affinity. Finally, I used a fast greedy modularity-optimizing algorithm to detect communities, or clusters, in this graph.
Results
The algorithm found seven distinct communities, which definitely correspond to ethnic groups and ethnic macro-groups in West Africa.
 |
| More info at: https://mcooper.github.io/ |
The red cluster includes Wolof, Serer, and Fulfulde place names, which makes sense, as all of these groups are Senegambian languages. This group of languages is the primary group in Senegal and Mauritania, which my classification picked up on. It also caught the large Fulfulde presence in central Guinea, throughout an area known as the Fouta-Djallon. This cluster also has a significant presence throughout the Sahel, stretching into Burkina Faso and dotted throughout the rest of West Africa, much like the migrant Fulfulde people.
The green cluster captures most of the area where Mandé languages are spoken, including most of Mali, where the Bambara are found, as well as Eastern Guinea and Northern Côte d'Ivoire, where Malinké is found. Interestingly, most of the toponyms in Western Mali fell into the Senegambian/Fulfulde cluster, and were not in the Mandé cluster, even though there are Mandé groups like the Soninké and Khassonké in Western Mali. Southern Guinea is densely green, representing the presence of Mandé groups there, like the Kuranko. Surprisingly, much of central and southern Côte d'Ivoire also fell into the green cluster, even through there are a couple of different groups there which are not in any way related to the Mandé groups that were most represented in the green cluster. This is also true of areas in Western Burkina Faso and Eastern Mali, where there are many languages unrelated to the broader Mandé group, such as Dogon, Bobo, Minianka, and Senufo/Syempire. However, I know that Dyula, a Mandé language closely related to Bambara, is spoken as a trade language in both of these areas (Côte d'Ivoire and Western Burkina Faso). It could be that Dyula has had a long enough presence in these areas to leave an imprint on the toponyms there.
The purple group pretty clearly captured two different disjoint groups that are both in the broader Mandé group - the Susu, in far Western Guinea, and the Dan, in Western Côte d'Ivoire. These groups are normally classified as being on quite separate branches of the Mandé language family, with the Susu being Northern Mandé and Dan being Eastern Mandé. However, the fact that the algorithm put them in the same group, even though they were too far apart to have edges/connections based on spatial affinity, shows that Dan and Susu toponyms have several three-grams common.
The yellow cluster seems to have caught two sub-groups within the broader green/Mandé cluster. Many of the yellow toponyms in central Mali are in what you could call the Bambara homeland, between Bamako and Segou. However, a second cluster stands out quite distinctly in southern Guinea. It's unclear to me what group this could represent and why it would have toponymic features distinct enough from its neighbors that the algorithm put it in a different cluster. Some maps say that a group called the Konyanka lives here and speaks a language closely related to Malinké.
The turquoise cluster quite clearly captures the Mossi people and their toponyms, as well as the Gurunsi, a related group (both Mossi and Gurunsi are classified as Gur languages).
The black cluster in southern Burkina Faso captured a group that most national ethno-linguistic maps call the Lobi, although this part of West Africa is known for its significant entho-linguistic heterogeneity. Another group of villages in Eastern Burkina Faso also fell into the black cluster, although I could not find any significant ethnic group found there.
Finally, the blue cluster captured both the Baoulé/Akan languages as well as the Senufo. It captured the Senufo especially in Côte d'Ivoire and somewhat in Burkina Faso, but not much in Mali, where I know the Senufo have a significant presence. This could represent a Bambarization of previously Senufo toponyms due to the fact that the government of Mali is predominantly Bambara, or it could pre-date the Malian state, as this area was part of Samori Toure's Wassoulou Empire, in which the Malinké language was strongly enforced. The classification of the Senufo languages has always been controversial, but this toponymic analysis suggests that they are more related to Kwa toponyms to the south rather than to Gur toponyms to the northeast.
Caveats
Some caveats with this work and its interpretation. For one, this only shows toponymic affinities. Those affinities usually correspond to ethnic distributions, but not always. There is a lot of migration in West Africa today, and place names don't usually change as quickly as the distributions of people. Thus, toponyms can sometimes encode historic ethnic distributions, for example many toponyms in the United States come from Native American languages, and there are many toponym suffixes in England that reflect a historic Nordic presence. Thus, this and similar maps are most informative when interpreted in combination with on-the-ground information and knowledge.
Another issue with classifying toponyms in West Africa in particular is that West African toponyms are transcribed using the Latin alphabet, which definitely does not capture all of the sounds that exist in West African languages. Different extensions of the Latin alphabet, as well as an indigenous alphabet, are often used to transcribe these languages, however these idiosyncratic methods of writing languages are not used in the geonames dataset. Thus, the Fulfulde bilabial implosive (/ɓ/ in IPA) is written the same way as a pulmonic bilabial plosive - as a "b", so this distinction is lost in our dataset, even though it adds a lot of information about what ethnic group a given toponym belongs to. However, some other sounds and sound combinations, which are very indicative of specific languages are captured using a Latin alphabet- for example prenasalized consonants (/mb/) common in Senegambian languages, labial velars (/gb/ and /kp/) common in coastal languages, or the lack of a 'v' in Mandé languages. Issues also arise with how different colonizers transcribe sounds differently, for example 'ny' and 'kwa' in English would be 'gn' and 'coua' in French. However, this didn't apply in this analysis, which only used Francophone countries, and I believe it could be dealt with if I tried to do a larger analysis.
Conclusion
This is an exciting time to be at the intersection of geography and linguistics! New datasets and computational methods are giving researchers the ability to ask newer and better questions about who belongs to what group, and where. I hope new developments in this research can yields new linguistic results about phylogeny, migration, and the spread of linguistic phenomena. Outside of the field of linguistics, better language maps could have broad applications, from improving disaster response planning to helping to answer critical questions about the origins of ethnic conflict.
Thanks for reading! You can check out my personal website for more detailed descriptions of these two projects, as well as other side projects I've done.
Thanks for reading! You can check out my personal website for more detailed descriptions of these two projects, as well as other side projects I've done.

Wow the blog is so informative.
ReplyDelete