Illustrating current questions in research on linguistic diversity
In relation to the previous post about the grand challenges of current research in linguistics I'd like to bring up four questions that are currently the focus of much contemporary research in linguistic diversity, and then illustrate them with maps. They are as follow:
- Why are there so many languages in some places and few in others?
- Why do some languages have more internal variation than others?
- Why are there so many language families and isolates in some places and not in others?
- Why are languages in certain areas so similar to each other despite not being related to each other, whereas other languages that are in contact are less similar?
- What is the possible design space of language and why do languages cluster in that space the way they do?
To illustrate these questions I'd like to present you with a series of maps. I really recommend you reading this post here about things to think about when you're reading maps of languages.
First some preliminaries:
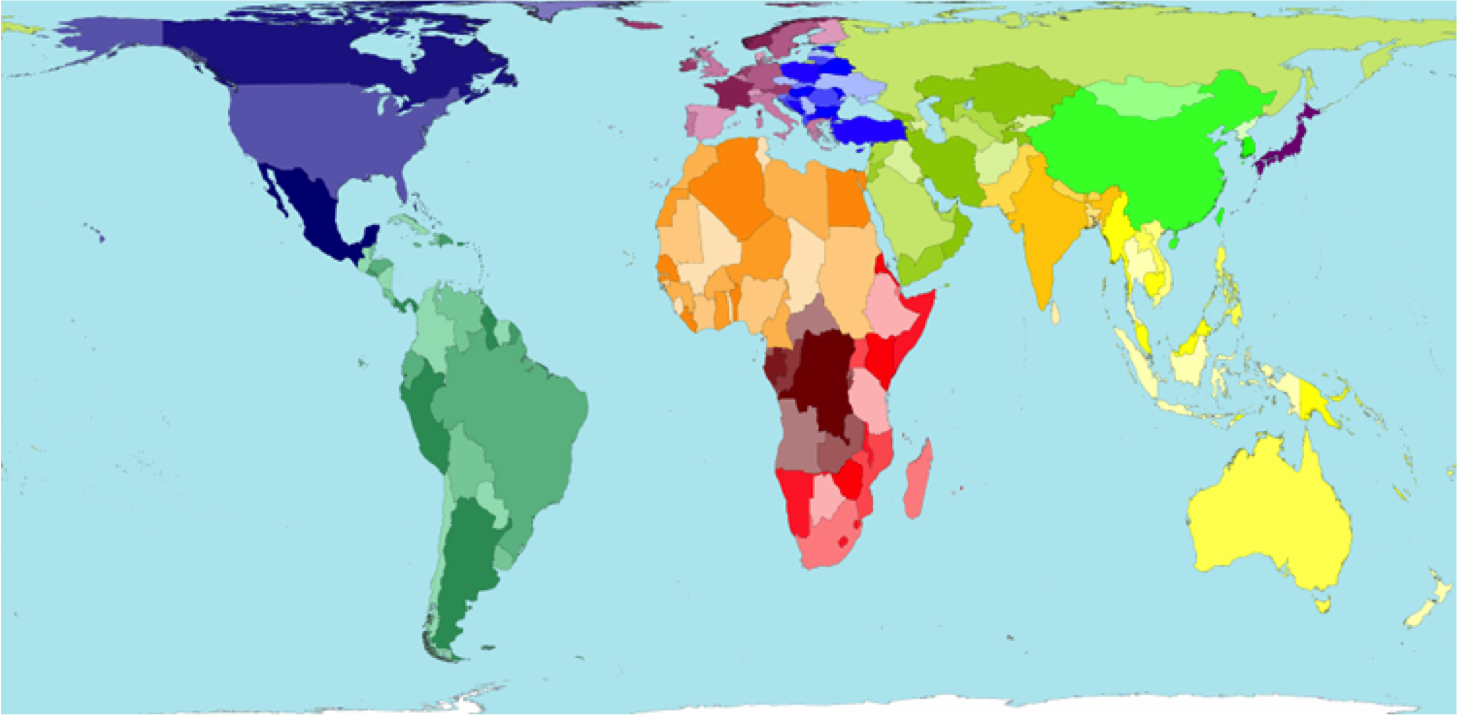
THE BASIC WORLD MAP PROJECTION OF WORLDMAPPER
This here is the basic map project from Worldmapper. The different states of the world are coloured differently, with some suggestions of larger areas being more similar (Central and Southern Africa, Pacific, South America etc). The map projection (how they have chosen to represent a 3D sphere in a 2D map) is similar but not identical to Gall-Peters.
THE WORLD MAP DISTORTED BY POPULATION
Here is that same map, but in this case the size of the states have been distorted in proportion to population size of humans in that state. You can have a look at many more on their site, including proportion of internet users or income.
© Copyright Sasi Group (University of Sheffield) and Mark Newman (University of Michigan).
LANGUAGES PER STATE (question 1)
Now, let's have a look at the amount of languages per state. This maps looks different from the one distorted by population. Most notably Nigeria, Papua New Guinea and vanuatu are much larger - whereas Europe and the Middle East is smaller. Mexico is bigger too, have a look!
© Copyright Sasi Group (University of Sheffield) and Mark Newman (University of Michigan).
ONE DOT PER LANGUAGE (question 1)
This here is a map from Ethnologue 2009, each dot is on language according to their classification. It for example complements the above map by showing WHERE in Australia and Mexico there are many languages
© 2009 SIL International
THE GENUS WALS SAMPLE (PROXY FOR PLACE WITH GREAT GENEALOGICAL DIVERSITY) (question 2)
A genus in the World Atlas of Language structures is a group of genealogical related languages with a shared history dating back no longer than 3500-4000 years. This is different from "family", by family linguists most often mean the very top level of genealogical units. The time depths of families can vary greatly, Proto-Uralic goes back to 7000-2000 BC (estimates vary) whereas Dravidian is only reconstructed to around 500 BC. Using genera as a unit makes for a more even time depth.
Anyway, the WALS features a core sample of 200 languages that is supposed to be included in all chapters - facilitating direct comparison. This sample is meant to be balanced so as to nor overrepresent any area disproportionally, meaning that if we look at where these languages are we get a hint at where there is great genealogical diversity. The 200 WALS sample contains 87 families and 175 genera. Each dot on the map is one language and the form and color of the dot corresponds to one genus. There's an interactive version that you can click around on here. Mind you, this is not a perfect illustration, but it gives you an idea.
This is from the World Atlas of Language Structures and Maddiesons chapter on tone. This map features 527 languages: 132 with simple tone systems, 88 with complex and 307 with no tone. What I want to show you here is that there are areas with genealogical diversity, such as Mainland South East Asia and West Africa, that are similar structurally.
Maddieson . 2013. Tone. In: Dryer, Matthew S. & Haspelmath, Martin (eds.) The World Atlas of Language Structures Online. Leipzig: Max Planck Institute for Evolutionary Anthropology. (Available online at http://wals.info/chapter/13, Accessed on 2014-12-17.)
MULTI-VALUE FEATURES IN APICS AND PRECENTAGES (sub-question to question 1)
Why do I bring this up in relation to internal variation, well you see in contrast to WALS languages in APiCS can have more than one value for a feature, for example both SVO and SOV. In addition, each datapoint is given a confidence level (excellent idea). This means that if a language has more than one strategy there were guidelines in WALS that directed which one you'd pick as the representative (probably most often the most frequent one), but in APiCS we get all possible constructions. We don't get to know what the variation correlates with, perhaps it's always SVO in subordinate and SOV in main clauses. Perhaps everyone on the south side uses one construction and everyone on the north another. This we cannot always know. However, if we are interested in variation within a language - not matter what it is conditioned by - this is actually useful. And it might be that variation that is condition by certain grammatical functions are also markers of a change in progress, just as regional variation etc. So, it is interesting.
I wouldn't say that APiCS maps are good at representing where there is more or less internal variation in the worlds languages, for one they only target contact languages which already makes huge difference and also we cannot vouch for how systematic these percentages are across languages and if the can be directly compared. But as illustrations of internal variation goes, this is the first thing I thought of.
Here is feature 11 in APiCS: order of frequency adverb, verb and object.
RESTRICTIONS IN DESIGN SPACE (question 4)
In the interesting of not overloading your brains I'll go for a very simple illustration for the fourth question about clusters in the design space - a table of word order frequency. If we imagine all the possible orders for what we have analysed as "subject", "object" and "verb" in languages of the world we come up with 6 orders. This is our possible design space in our model of analysing languages. We could instead think about thematic roles, constituents, topic-comment etc - but for the sake of simplicity and familiarity let's just consider the traditional concepts of subjects, verbs and objects. In this case, we're also ignoring any variation and just picking the "dominant" order for each languages.
If all orders were equally plausible we'd find an even distribution of languages. We do not. Languages do not spread out evenly in this design space that we've created and that Dryer has surveyed. This might be due to other features of the language and that there are sets of features that travel together, it might be due to information structure and memory, it might be due to just the set of 7 000 languages we have today are quirky. This is to me is one of the major questions in contemporary linguistics:
What are the historical, evolutionary, psychological, communicative, cognitive and social restrictions on the nature of language and its distribution in the possible design space?
Alors.. monsieur professeur Martin Hilpert: je vous donne mes sept questions de la recherche linguistique contemporaine (ou au moins ces que je peux trouver maintenant):
Pourquoi sont ils plus langues dans certain endroits et moins ailleurs?
Pourquoi avaient certains langues plus variation interne que d'autres?
Pourquoi y-a-t-il plus families des langues et des isolates dans certain endroits?
Pourquoi sont les langues de certain endroits plus similaire malgré n'étant pas lié?
Quelle sont les caractéristiques des langue qui sont plus affecté par contact et par étant liées?
Quelle sont les possibilités logical de les caractéristiques des langues?
Quelle sont les raisons pour les langue de notre monde de les distribue comme ils avaient?
</show-off> (I just felt like it, it's late in the night here in Canberra so one can go a bit wild and speak french to oneself, it's ok.)
Jag hoppas du tyckte det var intressanta frågor och bra illustrationer, jag inser att de inte är speciellt nya dock. Men men, i vilket fall. Trevlig kväll!
p..s I'd also like to bring up the issue of sign language typology and how it relates to contact linguistics - which is one of the most interesting things in the universe. But let's leave that for a later time ok?


Comments
Post a Comment