That infographic on languages of the world - some context to help you understand what's going on
Have you seen this infographic (click here for original post and larger size)? It's been floating around various linguistics blogs, been shared of 32 thousands times on the book of faces and been reblogged and retweeted in many other places.
I bet you found a flaw in it! Did you read the fine print and look up the sources (it's mostly from just this page)? No? It's ok. Allow me to give some explanation and context, as a diversity linguists working with public outreach - I'd like to take this chance to explain some things about data on languages of the world.

© 2015 Alberto Lucas López, South China Morning Post Publishers Ltd
The international edition of the newspaper South China Morning Post (SCMP) published this infographic of languages of the world on the 27th of May and later updated it. SCMP is an English language newspaper based in Hong Kong. They have a great internet presence and have made several neat infographics on other topics. This one is by Alberto Lucas López and in my opinion pretty good as infographics go - if you read the fine print and know how Ethnologue works. There are a few issues with this infographic and it's received a fair bit of criticism. I thought I'd take this opportunity to answer some questions and spread even more knowledge about linguistic diversity. If you're about to share this infographic, either comment on these matters brought up here or link to this blog post - it'll save you a lot of trouble and just in general improve the world.
This is not the first time I write about infographics, if you like this kind of thing you might want to read this post about the Economist's attempt to redraw the world according to major languages, this post about illustrating linguistic diversity using maps. this one about illustrating grand challenges of linguistics using maps and this one about the WALS sunburst explorer. I hadn't realised that I was so interested in this before, but well clearly I am.
Ok, onto the issues at hand.
There is an error in the data, fix it!
The information that is behind this infographic is mainly from Ethnologue (in particular table 3 of this page), a catalog of the worlds languages produced by Summer Institute of Linguistics International. The graphics at the bottom are also based on information from the CIA world factbook, UNESCO, United Nations, The University of Düsseldorf and the Washington Post. It is not entirely clear what is from where, but in most cases it is from the Ethnologue which means that you can look up the exact information, find the exact original sources and complain there. There is zero point in complaining to the SCMP or whoever is reblogging this image.Not all linguists like Ethnologue, and it is good to know that it is an American faith-based (formerly Christian missionary) organisation. I have written more about linguistics and Christianity here. However, this remains the most comprehensive and clearly referenced catalog of speaker/signer populations to date. There are other catalogues of language classification, such as Glottolog and MultiTree - but they do not, currently, contain population sizes.
Disagree and have a better published source of information concerning this data? Contact Ethnologue. I'm sorry but don't write to me or SCMP about it, we can't do nothing.
Ethnologue mainly deals in counts of native speakers and, like the infographics says in one of its fine prints, the data there is taken from a collection of different sources. The data that the infographic draws on is ONLY native speakers, and it's almost all from this page.
Sometimes Ethnologue gets information about speaker counts from a national census, sometimes from a fieldworker who was in the area 30 years ago. In either case, the source is always quoted so you can always find out. In some of those surveys multilingual people with more than one native languages might be given the chance to mark more than one, other times not - we cannot know for sure.
The reason for not counting second languages speakers is that it is very hard to get information on this globally and to know where to draw the line. Some people learn how to say "hello" and "thank you" and claim to speak a language, others might live in a country for 20+ years and use the language every day, but never feel included and therefore won't claim to master the language. We could use the tools like the Common European Framework of Reference for Language or the Assessment of basic language and learning skills. These are however mainly used in language education and for qualifications on resumes, they have not to my knowledge been used in any major global survey of second language competence.
Ethnologue does keep some sporadic information on second language users, but it is not as comprehensive as the first language counts. The main source I know of for second language population counts is a publication by Bentz & Winter from 2013 that combines Ethnologue and other sources, free PDF here. If anyone knows of other sources, lemme know. (Thanks Seán Roberts for recommending the Bentz & Winter-article, go read his excellent stuff on cultural evolution here.)
Disagree, would like a change and have a better published source of information concerning this data? Contact Ethnologue!
Chinese is not one language! Nor is Arabic!
The answer here is that they use a concept called "macro language", this is actually described in the text for the Chinese bubble, but should also be mentioned in relation to Arabic and explained in more detail. No-one is saying that Cantonese and Mandarin are mutually intelligible, this is not a claim by Ethnologue or the maker of the Infographic. However, they could have showed this better because it clearly is not communicated to readers. By the way, this is also true for Persian, Lahnda and Malay but few seemed to notice that. "Macro language" is also not an entirely awesome concept, more on this below.
What is and what is not a language is a very tough question. Has it got to do with cultural identity? Or intelligibility? What to do with highly multilingual communities like along the Casamance or in Souther New Guinea? How intelligible is enough? Can humans ever perfectly understand each other? (Also: what is the meaning of human communication, what is life?)
Linguists debate classification of languages all the time in specific cases, and in general terms. Most often what we consider is how mutually intelligible two varieties are and/or the amount of shared vocabulary, I highly recommend reading this post for more on this.
Besides dividing languages into dialects and languages, and representing their genealogical relationships by trees, Ethnologue also has a category called "macro language". This is category contains several closely related individual languages that are sometimes viewed as being one language. It could be that they were viewed as one in earlier linguistic classification (ISO 639-2), sometimes it also seems to have to do with the speaker community/society. Remember, it is very plausible that respondents to a census will write "Chinese" instead of "Mandarin"and that information then becomes hard for a survey to deal with without postulating the "macro language". It might not be pretty, linguists might not like it - but pragmatically it might be necessary. You can find a list of these languages here. Note that English, German, Spanish, French, Thai, Sami, and Portuguese are not macro languages (these were just a few potential candidates that I thought of).
For more on how specifically Ethnologue deals with dividing up languages, see this page.
Language X is not present!
This graphic has several bubbles and graphics. In the large bubble they only represent 23 largest languages/macro languages of Ethnologue. That leaves out over 7,000 languages. They write this clearly in the post, but it seems to have been missed by many.
 This data is directly taken from table 3 at the Ethnologue site, go have a look. This will answer why Thai is not present etc, and list all the languages that are lumped into the macro language "Chinese".
In this Infographic they, to my delight, remark that Ethnologue's total count of all speakers of all languages of the world is less than the entire population for the planet, i.e. they're missing data. I enlarged that part of the infographic here to the right because I thought it neat.
Few languages are spoken by many, few people speak many languages
Most languages of the world are spoken by very few people today. Here below is a table from Ethnologues statistics showing the same thing. This table is to be read like so: there are 8 languages that have between 100 million and 1 billion speakers each, these languages together make up 0.1% of the languages of the word and 40% of the speakers. There are 1,065 languages that are spoken by between 100-999 people each, they make up 15% of the languages of the world and 0.007% of the speakers.
Table 2. Distribution of world languages by number of first-language speakers
| Population range | Living languages | Number of speakers | ||||
|---|---|---|---|---|---|---|
| Count | Percent | Cumulative | Total | Percent | Cumulative | |
| 100,000,000 to 999,999,999 | 8 | 0.1 | 0.1% | 2,529,403,578 | 40.20547 | 40.20547% |
| 10,000,000 to 99,999,999 | 82 | 1.2 | 1.3% | 2,480,078,977 | 39.42144 | 79.62691% |
| 1,000,000 to 9,999,999 | 304 | 4.3 | 5.5% | 915,659,448 | 14.55462 | 94.18154% |
| 100,000 to 999,999 | 943 | 13.3 | 18.8% | 296,136,843 | 4.70717 | 98.88870% |
| 10,000 to 99,999 | 1,822 | 25.7 | 44.5% | 61,802,734 | 0.98237 | 99.87107% |
| 1,000 to 9,999 | 1,982 | 27.9 | 72.4% | 7,633,408 | 0.12133 | 99.99241% |
| 100 to 999 | 1,065 | 15.0 | 87.4% | 464,299 | 0.00738 | 99.99979% |
| 10 to 99 | 338 | 4.8 | 92.1% | 12,777 | 0.00020 | 99.99999% |
| 1 to 9 | 140 | 2.0 | 94.1% | 560 | 0.00001 | 100.00000% |
| 0 | 206 | 2.9 | 97.0% | 0 | 0.00000 | 100.00000% |
| Unknown | 212 | 3.0 | 100.0% | |||
| Totals | 7,102 | 100.0 | 6,291,192,624 | 100.00000 | ||
They should have showed linguistic genealogical relationships instead of regions
Sure, they could have done that instead. The point was, though, to show the distribution of languages in the world by geography.
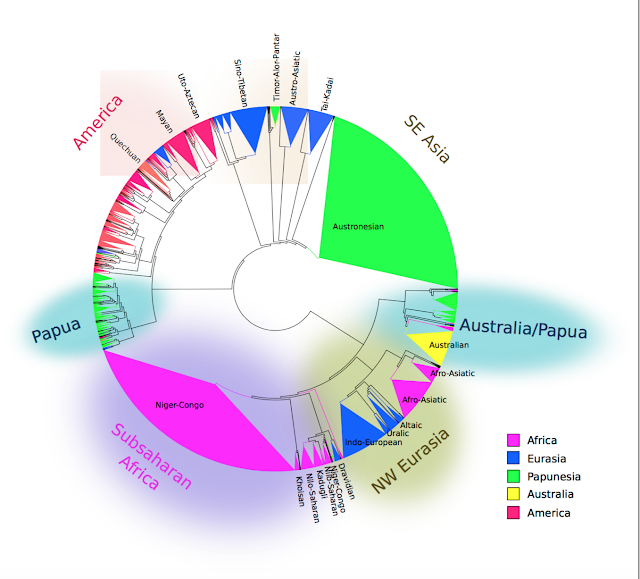
Notice the exact regions that the world is divided into: North America, South America, Western Europe, Eastern Europe, Asia Major, Asia Minor, Africa, Middle East and Oceania. These differ for example from Ethnologue's regions, Glottolog's macro areas or AUTOTYPs linguistic areas of contact (small illustration of those here, I couldn't find a better one right now). We don't know why this division was chosen, I for one have not seen the terms Asia Minor and Major since forever.
If you're interested in languages relationships through contact and genealogy, might I suggest playing around with the WALS sunburst explorer?
Why is the bubble for Bangladesh in Bengali light blue? It is not spoken in the "Middle East"! It should be the same color as India!
This is actually just a proper flaw, I got no explanation - it's just plain wrong. Might be a weird mixup because Pakistan and Bangladesh used to be one nation? Maybe? That's all I got.
There is an hidden agenda
Yes, this is true. This infographic clearly shows how large Chinese is and that it is spoken in fewer countries, this might be in order to imply that Chinese speakers are culturally more homogenous and "less colonial". This implication is not true, but it is what the infographic suggests. This is why data representation matters!
(It's always good to keep in mind that there is no such thing as totally unbiased news reporting. Western news papers also have agendas, this paper does too and quite clearly might I add. This is why we need to educate the people of the world to always be critical, be aware of biases and investigate sources on their own.)
This agenda is visible by focussing on regions instead of genealogical relationships, for example it is clear to see that English, French, Spanish and Portuguese are spoken on many different continents and therefore might have had more extensive far-reaching growth (i.e. colonisation) and less cultural homogeneity. This point is made even clearer by the little text that is provided in the infographic:
The reason why English, French and Spanish are among the world's most widespread languages has its roots in the imperial past of the nations where the originate.
This point is entirely true, there is no denying this. Not every great colonial power were interested in spreading their culture and language (c.f. the Dutch), but these empires clearly did.
To this, it is relevant to counter-balance with the information that there are 300 languages spoken in China, but only 56 recognised ethnical groups. Make what inferences you'd like from this.
Caveat: I don't know if the regional focus is meant to illustrate points about cultural homogeneity, this could be false.
EDIT: Please take note that even if we rank language varieties classified as languages, NOT macro languages, the Chinese language Mandarin rises to the top with its 848 million speakers. Again, see the table that is used as a base for this infographic here.
There are x number of citizens of country Y, hence there should be x number of speakers of the official language
Not every citizen has the official language as their native language. One way of measuring this is actually the Greenberg Diversity Index, indirectly. Read more about the GDI here.
Country X is missing from the bubble
In some cases the maker of the infographic has chosen to not represent each country if they have a low population, there is instead a grey bubble with a little plus-sign lumping all of those. In many cases, this is where the country you are looking for is. Go to Ethnologue and look up the country or language to learn more details.
Austria is missing from the German bubble
This is rather the mirror image of the Chinese issue, there people were complaining that it should be divided further but in the case of German Ethnologue is more splitting than many readers would like. Mighty interesting actually.. it says something about the readers and commentators.
There are more speakers of German in Switzerland than that!
What I said about Austria is also true in the case of Switzerland, Ethnologue counts Standard German and Swiss-German as two different languages, this is why it seems so "small".
There are more speakers of Persian in Tajikistan
People have also raised the issue of Persian in Tajikistan, which is a macro language covering Iranian Persian and Dari. In this case the speakers of Persian in Tajikistan, 50,000 according to Ethnologue, should be found in the grey bubble with the little plus sign. What you might be searching for is classified as its own language by Ethnologue: Tajiki (6.4 million speakers). Tajiki is highly related to Persian and said to blend into the dialect chain of Dari in Afghanistan. Why Tajiki is not included in the macro language Persian is not clear.
There are more speakers of English and French in Africa
Many commenters have also remarked that there are many more speakers of English and French in Africa. To that, well again I can only relay you to Ethnologue and tell you to ask them that they investigate this issue more. For now, they for example don't have any information on first language speakers of French in the Democratic Republic of Congo and count to "only" 28,000 in the Republic of the Congo (yes, those are different countries). French is the principal/official language of these two nations, but Ethnologue does not have more information on first language speakers there.
There are more speakers of English in India
Ethnologue counts to 350,000 first language speakers of English in India. I'm not convinced this is correct, nor the other counts above, and I'd be grateful for any advice on other published sources on population counts.
Does Ethnologue only care about linguistic criteria or does politics come into language classification: Hindi-Urdu and Serbo-Croatian
Ethnologue classifies Hindi and Urdu as two separate languages, but remark that they are quite mutually intelligible. They do NOT form a macro language. Why this is is actually not entirely clear, unless we look at the cultural identities of the two speaker populations.
The same goes for Bosnian, Serbian and Croatian which are three distinct languages of the balkans with different ethnic communities, but that all are included in the macro language serbo-croatian. Why Serbo-croatian is a macro language and Hindi-Urdu is not is not entirely clear.
It would seem that politics does play a role in Ethnologue's language-classification. Another resource for language classification is Glottolog, which does not have macro languages but that also counts Hindi, Urdu, Croatian, Serbian and Bosnian as five different languages.
In conclusionThe same goes for Bosnian, Serbian and Croatian which are three distinct languages of the balkans with different ethnic communities, but that all are included in the macro language serbo-croatian. Why Serbo-croatian is a macro language and Hindi-Urdu is not is not entirely clear.
It would seem that politics does play a role in Ethnologue's language-classification. Another resource for language classification is Glottolog, which does not have macro languages but that also counts Hindi, Urdu, Croatian, Serbian and Bosnian as five different languages.
I think this is a quite a good infographic, if one reads all the fine print and understands how Ethnologue works. People don't read all the fine print. Most people don't know how Ethnologue works. This is where it all breaks down. When you reblog this kind of information, it would be a good idea to spell a few of these things out, or if I may be so bold - just link to this post.
I think I caught most of the issues people have raised, though maybe not all. Kudos to people spotting these flaws, it shows people have some pretty good overview of the languages of the world. I was particularly impressed by the Persian speakers in Tajikistan-comments - good job!
What these points illustrate more than anything else is the lack of information of languages in the world (gaps in German speakers in Austria, potentially also of English and French in Africa and India) and the uneven application of concepts like "macro language" (why is German not a macro language but Chinese is?) I hope I've cleared up some of these issues, explained where they stem from and the need for exactly this kind of research in the future - and not only by SIL International.
Again: found a particular error and have a better published source of information concerning this data? Contact Ethnologue, I'm sorry but don't write to me or SCMP about it because we don't have the power to change Ethnologue. If you have any new interesting information that is not about correcting Ethnologue, you're welcome to write to me.
Thank you for your time.
EDIT: remaning issues
To Ethnologue
- Why is Tajiki not a member of the macro language Persian?
- Why is there no German macro language?
- Why is there no macro language with Urdu and Hindi? Or even language?
- Are there really so "few" speakers of English and French in South Asia and Africa? (That might be so, that wouldn't surprise me that much actually.
EDIT: Ethnologue clarified that "macro language" is a tool for mapping between another ISO code set for languages (639-2) and 639-3. It should not be understood to have any special meaning. They are aware that it is unevenly distributed. ISO 639-2 is not curated by SIL International but by the Library of Congress (USA). This mapping might have the result that macro language may consist of languages that are closely related or spoken by communities that are divided because of political rather than linguistics reasons, but it is NOT its function. This is confusing for most users.
To the infographic
- Why were the member languages of the macro languages Arabic, Lahnda, Persian and Malay not listed in the infographic but for Chinese they were?
- Why was "macro language" not explained?
- Why is Bangladesh marked as blue when it is not in the "middle east"?
- Why was this particular regional division chosen?
Bentz, C., & Winter, B. (2013). Languages with more second language learners tend to lose nominal case. Language Dynamics & Change, 3:1, 1-27. (free pdf here)
Hammarström, Harald & Forkel, Robert & Haspelmath, Martin & Bank, Sebastian. 2015.
Glottolog 2.4. Leipzig: Max Planck Institute for Evolutionary Anthropology. (Available online at http://glottolog.org, Accessed on 2015-06-09.)
Lewis, M. Paul, Gary F. Simons, and Charles D. Fennig (eds.). 2015. Ethnologue: Languages of the World, Eighteenth edition. Dallas, Texas: SIL International. Online version: http://www.ethnologue.com.
I´ve looked and looked... but should not the Scandinavian languages (Swedish, Norwegian, Danish and Islandic) be enough to mention in all this. Even if it linguistily is an evolution from the Germanic-languages - should it then be represented with a big enough area in the German language? Or did I miss any part of text or of the illustration?
ReplyDeleteYes, I'm afraid you did miss some text
Delete1) the big bubble in the middle only covers the 23 largest languages. None of the Scandinavian languages qualify.
2) the illustration goes by the definition of languages from the Ethnologue, where all scandinavian languages are separate entities (not even united under a macro language). Scandinavian languages are Germanic languages, I find the phrase "evolutions from Germanic-languges" a bit odd, I must admit. German is a Germanic language, English, Icelandic and Dutch are other Germanic languages. This is not an illustration of the largest language family branches of a depth of 3-4000 years (which would for example be the group "Germanic languages"), it's an illustration of the largest languages. I know it's confusing with "German" and "Germanic" being so similar, but please do keep them apart.
3) not in the illustration, but just to clarify further. Not all Scandinavian varieties are mutually intelligible (which isn't really relevant because varieties of a macrolg needn't be, but just so that that's clear) and even if they were they wouldn't climb much higher on the list with their combine total of 19,3 million speakers. It would probably put us on par with Serbo-croatian but we'd still be below top 50. This illustration was of top 23.
Great article! Thank you for the massive amount of work that obviously went into this piece!
ReplyDeleteNo worries, it's kinda my job. I work with public outreach of diversity linguistics, this is stuff I know very well so I'm happy to try and explain it to others.
DeleteWhy is Mexico a part of North America on the map, but a part of South America on the infographic? Mexico is entirely on the North American Plate, as well as a member of NAFTA, just to mention some of the criteria that put Mexico definitely as part of North America.
ReplyDeleteI don't know, you'll have to ask Alberto Lucas López. It makes no sense to me.
DeleteI don't get it. Indonesia has 250 million people with Bahasa / Malay as their primary language and according to the graph only 44 million speaks Bahasa. 88 million speaks Javanese and at least 90% of them speak Bahasa too
ReplyDeleteRemember, each person gets counted once and for their first language, most of these numbers are not adapted for native bilingualism meaning that if a person speaks Javanese as their first language and also standard Indonesian but not as their very first language, that still only counts once for Javanese. All this goes back to the primary data collection, which is most often census, so you have to dig deeper there.
DeleteAs I know that some people in Suriname also speak javanese since their ancertors were originally came from java. Also for any javanese who migrate to other countries even though they have to speak their new languages but i do believe they should be counted as javanese spoken person. This amount is significant enough to be measured.
DeleteThis method should be implemented for others person with different languages also.
This might be true, however always remember that the amount of people that retain their ancestors language when being a minority in a new country is usually very low, especially after 3 generations. Ethnologue counts native speakers, not all speakers. This is very important.
DeleteThe people who have migrated and have filed as speaking javanese in a survey in another country are still counted towards the entire pop by Ethnologue. Ethnologue makes a distinction between immigrant languages and indigenous, but still count all speakers towards the total. So, Javanese speakers in say the US are still counted in the entire pop of Javanese speakers, but they are classified as speaking an immigrant language in the US as opposed to speakers in Indonesia which are classified as indigenous. (Ethnologue reports 440 speakers of Javanese in the US.) As usual, smaller pops in countries are in the infographic found in the little bubble with a "+". Think of it as "other countries".
In the case of Javanese in Suriname, Ethnologue has classified that as a separate language from Javanese as spoken in Indonesia and Malaysia. Please go to Ethnologue.com and explore a bit for yourself, return if you have any further questions.
http://www.ethnologue.com/language/jvn
Great Article.
ReplyDeleteDo you also have any articles and facts related to Language origins and evolution...?
And regarding the Oldest existing language...
We have plenty of posts on language evolution, see this tag http://humans-who-read-grammars.blogspot.com.au/search/label/evolution
DeleteWhat do you mean by oldest existing language? All languages are technically equally old, in at least one sense (perhaps except for creoles and sign languages). You mean the one that has been most conservative and change the least, as far as we know? That's really hard to compare and test for. Could you please elaborate, it'll make it easier to answer :).
These kinds of infographics are very useful to create in private journals and blogs. I've used tools like creately to create infographics to my blogs.
ReplyDeleteThanks for your research Hedvig! I only found your post since I asked myself about Austria...
ReplyDeleteAh! Thanks. Yes, Austria is a special case in all of this, indeed.
Delete